
Презентация - Line graph
Нужно больше вариантов? Смотреть похожие Нажмите для полного просмотра 
|
Распечатать
- Уникальность: 89%
- Слайдов: 23
- Просмотров: 3634
- Скачиваний: 1627
- Размер: 1.99 MB
- Онлайн: Да
- Формат: ppt / pptx
Примеры похожих презентаций
 Internet fraud. Kspeu. Types of online fraud
 Geography
 Content:. Geographical location climate flag symbols interesting facts attractions
 Biographies of famous Russians
 Online test pad, как вариант создания интерактивного учебного контента материал
 Особенности организации дистанционного обучения по математике
 Дидактическое пособие «Лепбук «чистая планета»
Слайд 1
IELTS Academic Writing Task 1 Created by: M.Bolsynova
Line graph
Line graph
Слайд 2
Learning objective:
Слайд 3

Слайд 4

There are 5 kinds of graphs.
Слайд 5
You have to spend 20 mins in WT1 and write at least 150 words
Слайд 6
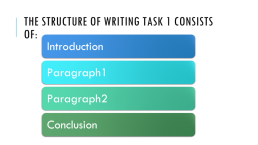
The structure of Writing task 1 consists of:
Слайд 7

In introduction you may paraphrase the question task
Слайд 8

In overview you have to include detailed description of a graph
Слайд 9

You may include your opinion when describing a graph
Слайд 10
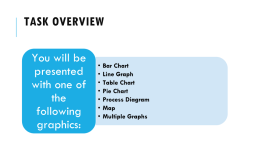
Task Overview
Слайд 11
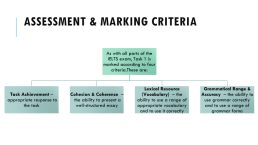
Assessment & Marking Criteria
Слайд 12
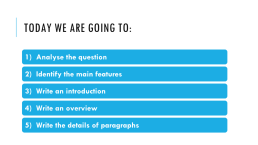
Today we are going to:
Слайд 13
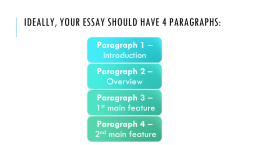
Ideally, your essay should have 4 paragraphs:
Слайд 14
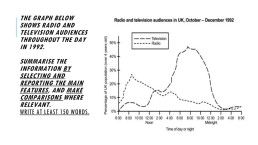
The graph below shows radio and television audiences throughout the day in 1992. Summarise the information by selecting and reporting the main features, and make comparisons where relevant. Write at least 150 words.
Слайд 15
Introduction
The line graph illustrates the proportion of people in the UK who watched TV and listened to the radio over 24 hours from October to December 1992.
The line graph illustrates the proportion of people in the UK who watched TV and listened to the radio over 24 hours from October to December 1992.
Слайд 16
Overall, a significantly greater percentage of the TV audience watched in the evening while radio had the most listeners in the morning. Over the course of each day and night, more people watched TV than listened to the radio.
Слайд 17
Paragraph 3:
Less than 10% of people watched TV between 1 am and 12 noon but at 4 pm this figure increased rapidly, reaching a peak of almost half the population at 8 pm. After this, the graph records a sharp decline in viewers, reaching a low of only a tiny percentage by 3 am.
Less than 10% of people watched TV between 1 am and 12 noon but at 4 pm this figure increased rapidly, reaching a peak of almost half the population at 8 pm. After this, the graph records a sharp decline in viewers, reaching a low of only a tiny percentage by 3 am.
Слайд 18
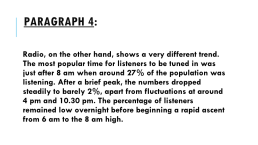
Paragraph 4:
Radio, on the other hand, shows a very different trend. The most popular time for listeners to be tuned in was just after 8 am when around 27% of the population was listening. After a brief peak, the numbers dropped steadily to barely 2%, apart from fluctuations at around 4 pm and 10.30 pm. The percentage of listeners remained low overnight before beginning a rapid ascent from 6 am to the 8 am high.
Radio, on the other hand, shows a very different trend. The most popular time for listeners to be tuned in was just after 8 am when around 27% of the population was listening. After a brief peak, the numbers dropped steadily to barely 2%, apart from fluctuations at around 4 pm and 10.30 pm. The percentage of listeners remained low overnight before beginning a rapid ascent from 6 am to the 8 am high.
Слайд 19
Слайд 20
Слайд 21
Слайд 22
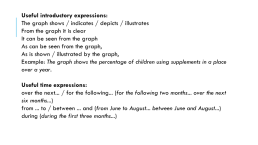
Useful introductory expressions: The graph shows / indicates / depicts / illustrates From the graph it is clear It can be seen from the graph As can be seen from the graph, As is shown / illustrated by the graph, Example: The graph shows the percentage of children using supplements in a place over a year. Useful time expressions: over the next... / for the following... (for the following two months... over the next six months...) from ... to / between ... and (from June to August... between June and August...) during (during the first three months...)
Слайд 23
Reference
IELTS Graduation, Student`s book, Mark Allen, Debra Powell, Dickie Dolby.
IELTS Graduation, Student`s book, Mark Allen, Debra Powell, Dickie Dolby.
^ Наверх
X
Благодарим за оценку!
Мы будем признательны, если Вы так же поделитесь этой презентацией со своими друзьями и подписчиками.